Curling Analytics
Growing up in Canada, curling is a very popular sport, which I have played both competitively and socially at different points in my life. As it turns out, there is a wealth of data available on curling games, but it is mostly available in the form of PDF documents with diagrams of the playing area (that is, not readily analyzable). In this “Curling Analytics” project, I extract this data into an SQL database, and perform analyses of it.
In this case, the “wealth of data” consists of 1,269 games spread across 24 events, for a total of 182,775 shots across 11,472 ends. There is a lot that can be done with this data, so stay tuned for future analyses! Currently, this project is broken down into the following sections:
- A Brief Introduction to Curling
- Getting the Data
- Storing the Data
- Initial Exploration
- Battle of the Sexes: Investigating a Game Strategy Gender Stereotype
You can find all the code written for this project here on my GitHub.
Further analyses of this data are written up on their own dedicated pages. You can find them here:
A Brief Introduction to Curling
In the sport of curling (as traditionally played), in each game two teams of 4 players each play against each other. The game is played on a sheet of ice, which looks like this:
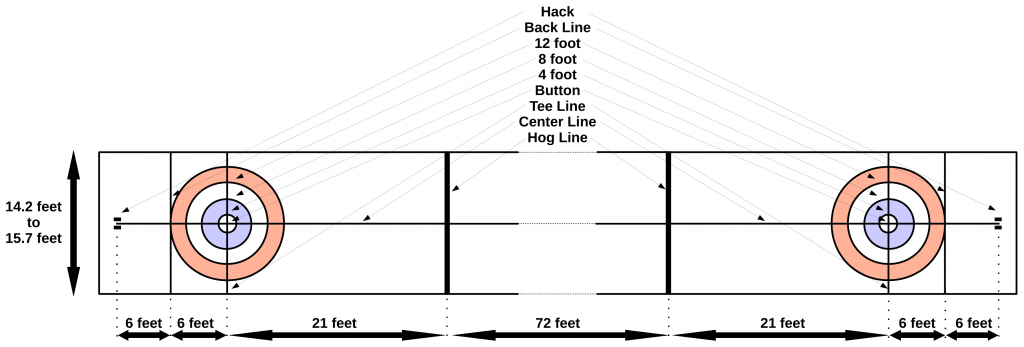
A player launches from the hack on one end of the sheet with a stone in hand, slides out, and releases the stone before crossing the closest hack line to them. A stone is in play if it is past the hack line on the other end of the sheet, but not past the back line on that end.
In each round (called an end) each player throws two stones, with successive shots alternating between the two teams. The team to throw the last stone in the end is said to have last rock advantage, also known as the hammer. Which team gets the hammer in the first end is decided by coin toss, with the other team getting their choice of stone color. When a team scores in an end, the other team has the hammer in the next end. As a matter of strategy, it is generally considered not worthwhile to give up the hammer for only one point. Curling games are typically 8 or 10 ends in length, and at the end of the game the team with the most points wins. In the event of a tie, sometimes an extra end is played, though in some cases the game is just decided by which team can throw a stone closest to the button.
The scoring at the end of each end is done by examining the stone configuration in the house, which is made up of the button, and three concentric rings (the 4 foot, 8 foot, and 12 foot, all named by their outer diameter.) Rocks that are inside (or at the very least in contact with, called biting) the house can count for points. At the end of the end, the team with the stone closest to the center of the button (the pin) scores points, and the number of points scored is equal to the number of stones they have in the house that are closer to the pin than any of the opposing team’s stones.
The four positions of each team are named according to the typical shot order:
- Lead
- Second
- Vice
- Skip
The Skip is the player that “calls the shots”, standing on the side of the sheet with the stones in play, determining the strategy for the game, directing the throwing player where to aim, which direction turn to put on the stone, and how hard to throw it. While one player is throwing, the other two players follow their stone down the ice, sweeping in front of it to help it move farther or stay on a straighter path, as needed. The Skip will typically direct them in matters of straightness (as they can see the angles), but the two players sweeping have a better idea whether the rock needs to be swept for speed.
When it is time for the Skip to throw their stones, the Vice comes down to the side of the sheet with the stones in play, confers with the Skip on strategy, and plays the Skip’s roll for the Skip’s shot.
In this dataset, there are the following types of shots called:
- Clearing: A hit, where a guard (a stone in front of the house) is removed from play, along with the rock that was thrown.
- Double Take-out: A hit that removes two stones from play.
- Draw: Place a stone inside the house.
- Freeze: Place a stone so that it is touching another stone, but did not move it.
- Front: Place a stone in front of the house, blocking the button (i.e. a special case of “Guard”).
- Guard: A stone in front of the house, blocking an area of strategic importance or protecting a stone from being hit.
- Hit and Roll: A hit where the hitting stone travels to a specific location before stopping.
- Promotion Take-out: A hit where a stone is hit and pushed back (“promoted”) so that it hits another stone to remove it from play.
- Raise: A stone is used to move a stone in play farther down the sheet. (For example, a guard in front of the button could be raised to the button.)
- Take-out: A hit, the thrown stone removes another stone from play.
- Through: Throw the rock through the house and out of play. Normally done when trying to limit the number of rocks in play (“keeping it clean”) or if there are no stones in play in the last rock of the end and you don’t want to give up last rock advantage for one point.
- Wick / Soft Peeling: Two conceptually similar shots:
- Soft Peeling: A lower power version of “Clearing”, where a rock is used to move a guard out of the way, but keep it in play. One might use this during the 4 rock free guard zone (see below) to make a guard placed by the opposing team less useful.
- Wick: Bounce your stone off of another stone in play, to chain your stone’s direction, (e.g. if you want to put your stone behind another stone, but curling it there directly is not open, and there’s another stone you can bounce off of.)
There is one additional rule concerning shot types that is worth explaining, called the 4 rock free guard zone. At the beginning of each end, 4 stones must be thrown before any stones in play outside of the house and between the tee-line and the hog line can be removed from play. This is nominally to prevent “each team just removes the opposing team’s stone from play with their shot” from being the best strategic play (that would make for a very boring game!).
Now that we understand the basics of curling, let’s start digging into the data!
Getting the Data
As the world governing body of the Olympic and Paralympic Winter Sport of Curling, the World Curling Federation produces (and makes available) shot-by-shot summary PDF documents of most games in the World-level events under their purview. For each shot, the information is typically formatted as:
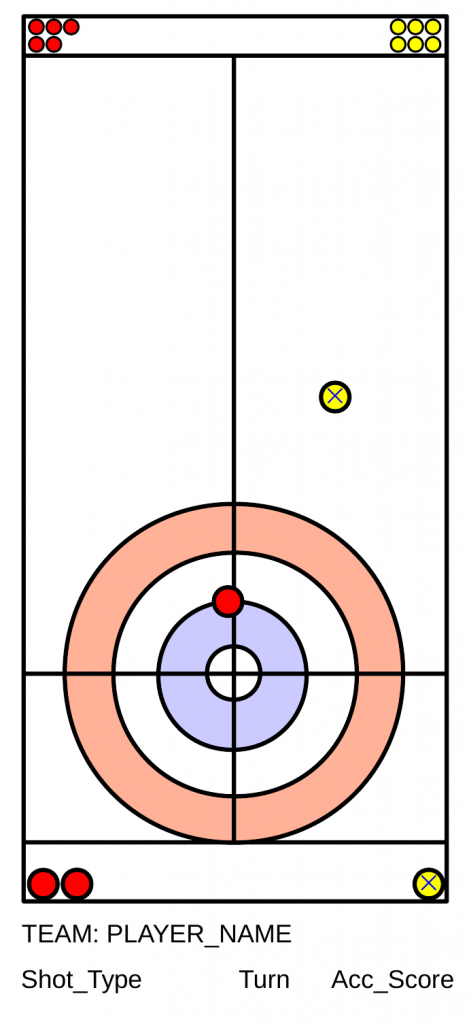
- A diagram of the area of the sheet currently in play.
- A code denoting the player’s team (TEAM, typically a 3 letter country code).
- The player’s name.
- The type of shot that was called.
- The direction of rotation of the rock (the “turn”).
- A score of how accurately the player executed the shot that was called (0-4, or 0% to 100% in 25% increments, with 100% being “perfectly executed”.)
I used a python script to traverse the directory structure where these shot-by-shot summaries are stored, extracting information on the event name, game name, and whether it is a Men’s or Women’s game from the directory path. Using the Linux “pdftohtml -xml” command to convert the PDF files into XML, I was able to extract the above shot-by-shot textual information using the positions provided in the XML tags, and knowledge of the relative positions of this information relative to the diagram of the area in play. These pages can also include a box with information on the score and the time remaining for each team, which I also extracted using relative positions in the XML document.
Extracting the stone positions from the diagram of the area in play posed more of a challenge. Looking through a few of the shot-by-shot summaries, thankfully the following rules tend to hold:
- Rocks not played are smaller in size, on the end of the diagram opposite the house.
- Rocks that are out of play are all behind the back line (behind the house).
- Red rocks are always RGB (255, 0, 0), and yellow rocks are always RGB (255, 255, 0), with a blue (0, 0, 255) “X” through them.
- In practice, there were slight variations on these colors present, so the ranges of acceptable colors were tweaked slightly to accommodate.
- Indicators of a rock’s previous position are a hollow circle of that rock’s color.
- The positioning of the button and the house is consistent to within a pixel or so, when converting between directions of play.
With this information and Python’s OpenCV2 module, I defined a mask for each stone’s color profile, and found the contours in the mask, taking their centroids to get the stone positions. The size and position of stones allowed me to filter out stones that were out of play, and to determine the direction of play (based on the location of the smaller, unplayed stones) and match a team’s country code to its rock color (based on which team has only 7 stones left unplayed after the first shot).
The only minor frustration with the stone positions is that based on measuring the diameters of the rings, the diagram is not actually a to-scale representation of the curling sheet. So instead of converting to a unit of measurement, stone positions are stored as pixel positions. However, I did standardize to the “down” direction of play (house at the bottom, as the skip would see it), and converted the coordinate system so that (0,0) is at the center of the button.
With the problem of extracting the data solved, let’s discuss how I chose to store it.
Storing the Data
Looking at the structure of a curling competitive event gives us a clear hierarchical structure:
- The event itself.
- The games within the event.
- The ends within a game.
- The shots in each end.
- The positions of the stones in play after each shot.
So, it makes sense to reproduce this hierarchical structure in an SQL database with a table for each step of the hierarchy, each containing a foreign key referencing the next step up the hierarchy. I chose SQLite for this database, since the database is relatively simple and small, and doesn’t require remote access by multiple users. This SQL database has the following schema (produced using dbdiagram.io):
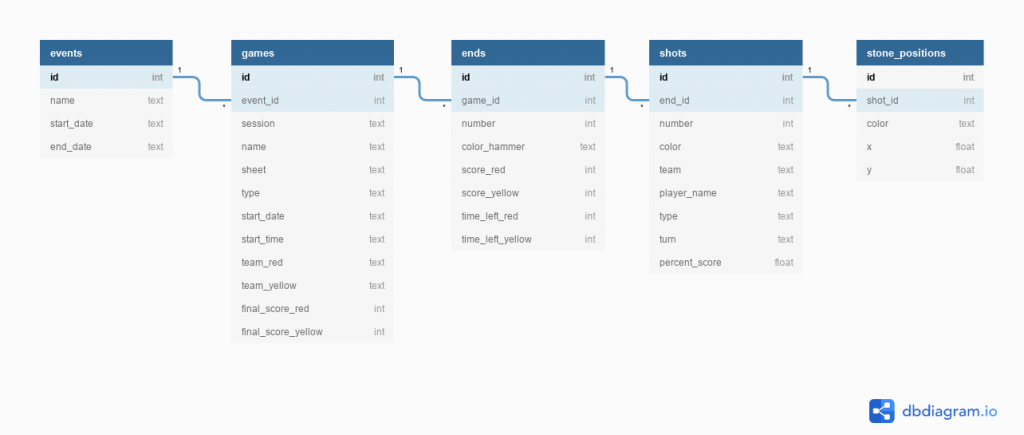
Let’s now go through each table and define the contents of each of the columns.
events
- id: The id number of the event (the primary key).
- name: An abbreviation of the name of the event, taken from the top-level directory name its shot-by-shot summaries are stored in.
- start_date: The date of the first game of this event.
- end_date: The date of the last game of this event.
games
- id: The id number of the game (the primary key).
- event_id: The id number of the event that this game is a part of. (The foreign key).
- session: The session name from the folder where the shot-by-shot summary was stored.
- name: Normally matches the session name, though may contain different information (e.g. group name, if the round robin was broken up into groups.)
- sheet: The identifier of the sheet the game is being played on.
- type: The kind of game (currently either “Men” or “Women”. Data is also available for “Mixed Doubles”, though I did not extract it.)
- start_date: The date of the game in YYYY:MM:DD format.
- start_time: The time the game started in HH:MM (24 hour clock) format.
- team_red: The short name (e.g. CAN, USA, SWE, SCO, etc.) of the red team.
- team_yellow: The short name of the yellow team.
- final_score_red: The final score of the red team.
- final_score_yellow: The final score of the yellow team.
ends
- id: The id number of the end (the primary key).
- game_id: The id number of the game that this end is a part of (the foreign key).
- number: The number of the end in the game (typically ranges from 1 to 10, though some games are shorter, or can go to an extra end due to a tie.)
- direction: The direction of play on the sheet, given by whether the house is at the top of the shot diagram (“up”) or at the bottom (“down”). All stone positions are converted to the “down” coordinate system for consistency.
- color_hammer: Color of stones thrown by the team with the hammer (last rock advantage).
- score_red: The red team’s score at the end of this end.
- score_yellow: The yellow team’s score at the end of this end.
- time_left_red: How much time remains on the red team’s clock at the end of this end, in seconds.
- time_left_yellow: How much time remains on the yellow team’s clock at the end of this end, in seconds.
shots
- id: The id number of the shot (the primary key)
- end_id: The id number of the end that this shot is a part of (the foreign key).
- number: The number of this shot in the end (normally 1 to 16).
- color: The color of the stone being shot (red or yellow).
- team: The short name of the team making the shot (e.g. CAN, USA, JPN, etc.).
- player_name: The name of the player taking the shot.
- type: A string categorizing the type of shot being made (e.g. Draw, Take-out, Hit and Roll, etc.).
- turn: “In” or “Out” in older games where this terminology was used. “Clockwise” or “Counterclockwise” in the later games, referring to the rotation direction of the rock. Translating between these conventions requires knowledge of the handedness of the player, so this data was left as-is. (For a right-handed player they correspond respectively, for a left-handed player it is the opposite.)
- percent_score: The percentage score assigned to each shot, stored as a real number. Ranges from 0 (a complete miss) to 100 (perfectly executed.) Normally just an integer number on a 0 to 4 point scale (0, 25, 50, 75, 100).
stone_positions
- id: The id number of this stone position entry (the primary key).
- shot_id: The id number of the shot that this stone position was recorded after.
- color: The color of the stone (red or yellow).
- x: The x position of this stone, in the “down” coordinate system, with (0,0) at the center of the button.
- y: The y position of this stone, in the “down” coordinate system, with (0,0) at the center of the button.
Initial Exploration
Although I was pretty careful to test my data extraction code as I went along, once I had completed extracting the data from the PDF shot-by-shot summaries, I went through each table in the database column-by-column, to check whether the extracted data was reasonable. The full Jupyter notebook with this exploration is here on my GitHub.
To summarize some of the more impactful or interesting observations:
- In the games table, session names are reliable, but the numerical values included in them mean that “Semi-Finals” or “Finals” may not be consistently named in different events. As stated earlier, the names table sometimes contains this information, sometimes contains other information (like the “Group” ID), or no information at all. The PDF formatting here was not consistent enough for this to be more reliable.
- The team’s name is almost always a 3 letter country code, except for an event where Canada fielded two teams (CAN1 and CAN2).
- 10% of the games in the games table have no final score recorded, and 30% of ends in the ends table have no score recorded, due to missing score boxes.
- I chose the score box to extract the score because it was easiest to parse, but apparently it is missing a lot of the time.
- There is score information available elsewhere on the page that could be extracted instead.
- The score could also be reconstructed from the stone positions in the last shot of the end easily enough as well.
- The time_left variable is even more problematic, missing from 80% of ends, either due to a missing score box or just being entered as 0:00. There is unfortunately no other way to get this information.
- There are a few artifacts that have appeared in the diagram of the playing area at times, and disrupted the determination of the team color with the hammer. This is an extreme edge case (something like 0.1% of ends).
- Very rarely the turn column in the shots table picks up a notation of a non-standard situation (like “Free guard zone violation”) instead of any turn.
I also produced a plot during this initial exploration that is worth discussing here. As a check on the validity of the positions stored in the stone_positions table, I produced a heat map of all the stone positions. Recall that in stone_positions, all positions are oriented with the house at the bottom, and the center of the button (“the pin”) at (0,0), with positive x going to the right, negative x going to the left, positive y towards the hog line, and negative y towards the back line. The range of this plot is based on the range of positions in the stone_positions table, and given the nearly 700,000 positions it contains, the full range of the area in play should be covered. To further guide the eye, we should also note that the back line (minimum y) and the front of the house should be equidistant from (0,0). Without further ado, here is the plot:
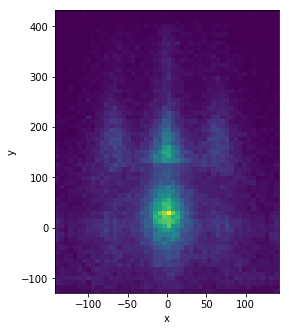
So, what do we see here?
- A large concentration of stones near the button (near (0,0)), with a clear bias towards being in front of the button. This makes sense, since the button is the most desirable place to be for scoring, but if the stone goes past the tee line (to negative y), you leave open a draw (with your stone as backing) to a better scoring position for the opposing team. So, if the goal is “as close to the center of the button as possible, but no further”, a bias for stones to be in front of the button makes sense.
- A large concentration of stones near the centre line just outside the house (near (0,130)). This is where a “center guard” is typically placed (often as the first shot in an end) to give cover for a stone on the button.
- Increased concentrations of stones off to the sides of the button, and protecting these positions out in front of the house. These both factor into the strategy if you have last rock advantage (i.e. try to place and protect a stone towards the side of the house, typically the 8-foot, while keeping the button open, nominally allowing you to draw to the button on the last shot for 2 points.)
So, the initial exploration of the data shows that it looks reasonable, with a few caveats based on which table columns are being used. In particular, the stone_positions table also shows that popular positions make sense in the context of basic curling strategy. With the data sufficiently understood, let’s proceed to some more in-depth analyses.
Battle of the Sexes: Investigating a Game Strategy Gender Stereotype
Introduction
Growing up a young curler, there was a well-known gender stereotype concerning a difference in strategy between Men’s and Women’s games. It can be summarized as this:
- Men prefer a more “violent” strategy that tends towards more hits, resulting in fewer stones in play.
- Women prefer a more “finesse” strategy that tends towards fewer hits, resulting in more stones in play.
Or, more succinctly, “Men prefer to hit more than Women.”
In fact, I even remember one coach claiming that because of this, he preferred to watch Women’s games over Men’s games, because less hitting means more stones in play, which makes for more complicated shots to watch the players make.
So not only is this difference between Men and Women claimed to exist, it is also claimed to be so pronounced that it is readily apparent to someone watching a curling game. This data set contains data for over 80,000 shots for Men and Women each, spread out over 5,000 ends each, so this data set should be more than sufficient to spot such an apparently obvious difference.
Methodology
The nature of this stereotype gives us two main options for checking its veracity from the data:
- Shot Type Analysis: Checking whether Women actually call significantly fewer “hit” type shots than Men.
- Stones in Play Analysis: Checking whether the maximum number of stones in play in each end is actually higher for the Women’s games than the Men’s games.
Both of these analyses strike to the heart of the stereotype. The Shot Type Analysis looks directly at the strategy preferences of Women vs. Men with regards to hits. The Stones in Play Analysis addresses the part of the stereotype that correlates less hitting with more rocks in play. We will therefore look at this claim from both directions, acting as a cross-check of each other.
For both analyses, we can produce histograms or bar charts of the relevant quantities, and generate contingency tables from these plots to feed into a χ² test to determine the statistical significance of any difference we observe.
Before proceeding to the analyses, we need to make an important distinction. Both of these datasets are pretty large: 80,000 shots for Men and Women each, and 5000 ends for Men and Women each. This is ostensibly enough data that we could find a statistically significant difference between Men and Women that is nonetheless too small to perceive on the scale of one game. Remember, the stereotype we are looking into includes the claim that it is obvious to the average person watching a game. So in both analyses, we should use the whole dataset to determine the average shot type or maximum stones in play distribution, and apply it to a game (80 shots by one team), and see whether it is statistically significant (i.e. something a viewer could see) while watching one game.
In all cases, our null hypothesis is that Men and Women call hits equally, and we set our threshold to reject the null hypothesis if p < 0.05.
The full Jupyter notebook for this analysis can be found here on my GitHub.
Analysis 1: Shot Type
As we discussed earlier in “A Brief Introduction to Curling”, the various shot types called by the skip are included in the shot-by-shot summaries, and have been tabulated in the SQL database. Cleaning this data further by filtering out instances of “None”, “no statistics”, and “not played”, and merging the “through” and “Through” shot types into “Through”, we find that we have 93,112 shots from Men’s games, and 84,818 shots from Women’s games to consider. Having an unequal number of shots for Men and Women, we plot the percentage of each shot type by gender.
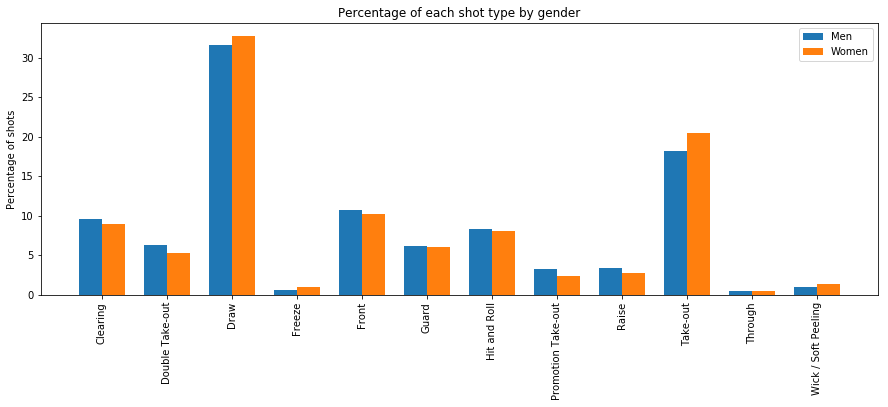
Taking a broad first look, the stereotype appears to be on shaky ground, as the percentages of each shot type for Men and Women appear to be remarkably similar. Furthermore, the “Take-out” shot type, the most common type of hit, is actually called by Women MORE than it is by Men. That said, the higher power, more difficult hits (Clearing, Double Take-out, and Promotion Take-out) are called slightly more by Men than Women, but this is still not much of a difference.
Feeding the shot type data into a χ² test tells us that there is definitely a statistically significant difference between the shots called by Men and Women (p = 2 × 10−110), at least on the scale of the full dataset.
However, the stereotype claims that the difference between Men and Women is obvious when you are watching a game. So if we use the fraction of each shot type to get a shot type distribution for a team’s shots in one game (a total of 80 shots), we would expect to see a statistically significant difference between Men and Women. Alas, we do not (p = 0.9999987). So we are forced to conclude that yes, there is a difference in the shots called by Men and Women, but no, it is not big enough to see when you are watching a curling game.
This shot type comparison was ultimately more fine-grained than the stereotype claimed. To answer the question of “Do Men hit more than Women?”, we should categorize all of the shot types as either “Hit” or “Not Hit”, and repeat the analysis with only those two shot categories. A Draw obviously falls under “Not Hit”, and a Take-out obviously falls under “Hit”, but some shot types straddle the boundary, and require a judgement call:
- Hit and Roll: This type of shot is primarily a hit, but does have the more finesse component of having the thrown stone go somewhere specific. I have classified this as a Hit.
- Raise: Although the thrown stone does hit another one with this shot type, this shot is for moving a stone to a more favorable location, still in play. This strikes me as more of a finesse shot, requiring careful control of the stone’s momentum to pull off, so I have classified them as “Not Hit”.
- Wick / Soft Peeling: The Wick (bouncing the thrown stone off another rock to change direction) is definitely a finesse shot, while Soft Peeling strays closer to what we would classify as a hit, but nonetheless involves a lot of finesse (fine control of the stone’s momentum, instead of a show of brute force.) I have therefore classified this category as “Not Hit”.
So, this gives us the following shot types in each category:
| Hit | Not Hit |
| Clearing | Draw |
| Double Take-out | Freeze |
| Hit and Roll | Front |
| Promotion Take-out | Guard |
| Take-out | Raise |
| Through | |
| Wick / Soft Peeling |
With these categories in mind, here are how the fractions of “Hit” and “Not Hit” shots break down between Men and Women:
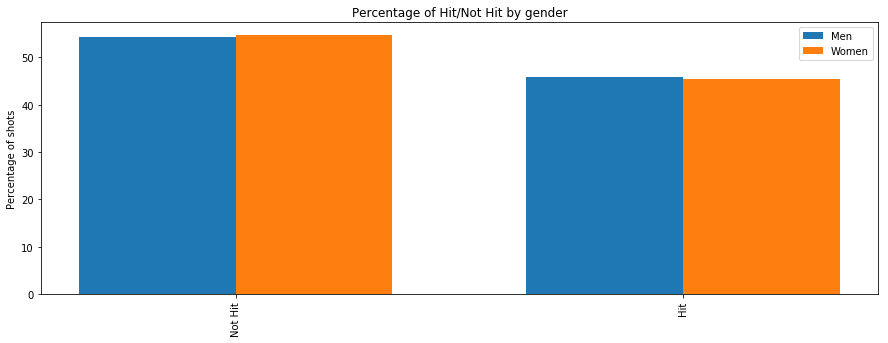
This comparison seems to make Men and Women look even closer, though here Men take a slight edge over Women in percentage of Hit type shots. Performing the χ² test on the Hit/Not Hit counts for Men and Women in the dataset gives us a p-value of p = 0.07, which just misses the threshold of 0.05 for rejecting the null hypothesis that Men and Women call Hits equally. It goes without calculating that if we don’t see a statistically significant effect on the scale of the full dataset of shots, a “Hit” vs. “Not Hit” difference between Men and Women would certainly not be noticeable on the scale of a game or even a whole event.
In conclusion, I can’t find any support in the shot type data for the stereotype that Men call hit shots more than Women. There is definitely a statistically significant difference between the shot types called by Men and Women (that may be worthy of further probing in a future analysis), but this difference is small enough that you wouldn’t notice it on the scale of an individual game.
Analysis 2: Stones in Play
This analysis approaches the stereotype from a different angle. If Men are truly executing proportionally more hits than Women, then since hits typically remove stones from play, we should see Women’s games having more rocks in play. Remember this was part of the stereotype: that Women hitting less results in more stones in play, making for trickier shots and therefore a more interesting game.
We can evaluate this claim simply by finding the maximum number of stones in play in each end in our SQL database. This gives us maximum stone counts for 5986 ends in Men’s games, and 5485 ends in Women’s games. So, we plot a histogram of the fraction of ends with each maximum number of stones in play, for Men and for Women:
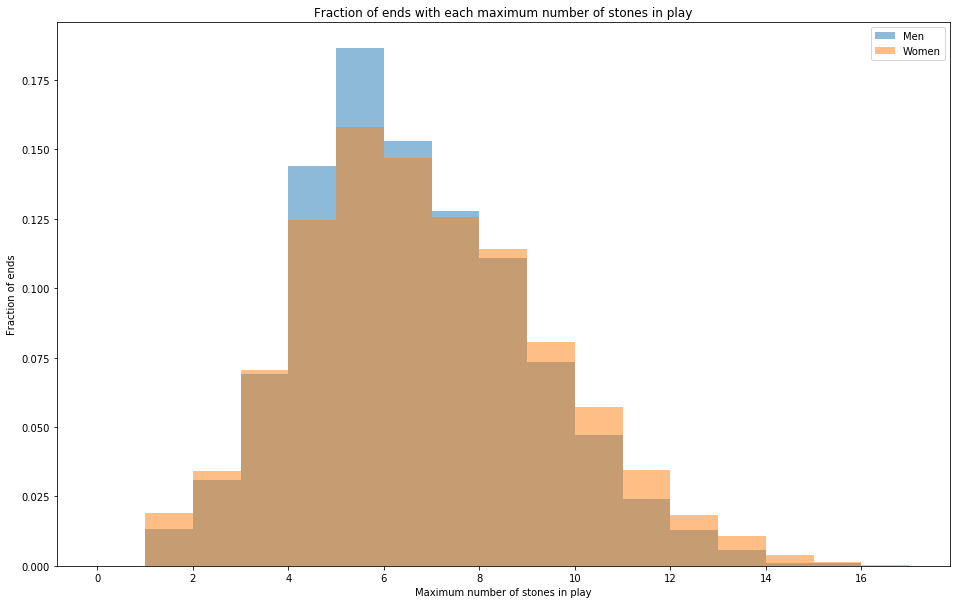
Looking at this plot, once again the Men’s and Women’s distributions are pretty similar. Both are peaked at 5 stones in play, though the Men’s distribution is more strongly peaked there (Women’s games having a slightly higher percentage of games with both higher AND lower maximum stone counts).
Performing a χ² test on the maximum number of stones in play data, we find p = 5 × 10⁻¹⁰, so these two distributions are indeed statistically significantly different from each other.
However, given how similar they look, we once again wonder whether your average game viewer would be able to detect this difference. Using the distributions above, we produce maximum number of stones in play counts for 1000 ends (an event with 100 games of 10 ends each). Here, the χ² test gives us p = 0.6, which is not even close to our threshold for rejecting the null hypothesis. So the observed difference between the maximum number of stones in play between Men’s games and Women’s games is not noticeable in an event of 100 games, let alone a single game. So, the contention that Women’s games have more stones in play, and are more interesting to watch as a result, doesn’t seem to hold any water.
Conclusions and Discussion
We have examined the stereotype that Men prefer to hit more than Women from two angles: looking at the shot types called by the skip, and looking at the maximum number of stones in play. Based on what I had heard growing up a young curler, I was expecting a very pronounced difference between the Men’s games and the Women’s games, but the data does not seem to back that up. In both analysis methods we found that there are statistically significant differences between the Men’s and Women’s games, but that these differences are not large enough to be detected by someone watching a single game, or in the case of the maximum number of stones in play, an entire event full of games. Since this stereotype also claims to be obvious, this data does not support the stereotype.
Note, however, I referred to “this data”. Something important to keep in mind here is that this dataset is filled with games at the international competition level, where each country competing is sending its very best curling team. If the magnitude of this stereotype is inversely correlated with the skill level of the players, we would not see it at this level of play. (Indeed, any novice curler will tell you that hits are some of the hardest shots to make!) Data on lower level games is probably much more difficult to find, so this hypothesis will have to go untested for now.
Another aspect not considered here was varying skill levels between the different teams. I was always coached that when facing a superior team that could hit with high accuracy, the better strategy is to “play the junk game”, to force the opposing team to make trickier finesse shots in order to win. This effect may also be smaller at this high level of play, but there are definitely teams that always tend to do well, and teams that may rarely make it to international competition, so it would be interesting to see how the shot types called change when comparing the accuracy score for the shots made by each team.
On a similar note, I suspect that the shot type preferences may vary team-to-team anyway. A big part of effective curling strategy is to tailor your strategy to the skill level of your players. Each team may therefore have its own preferences, and it would be interesting to see how this compares to the average we saw in the Men and Women shot type comparison.
Finally, the logical next extension of these analyses is into a second dimension: time. The strategy at the beginning of an end tends to weigh heavily towards guards and draws, with more take-outs towards the end of the end. Furthermore, as a game progresses, if your team is winning, you will probably pursue a “keep it clean” strategy, to try and hold on to your lead. Could differences between how Men and Women play the game manifest when considering this time variation? What about considering the score differential? Similarly, we could look at the number of stones in play after each shot in each end, instead of just the maximum number.
In closing, the stereotype that there is an obvious preference for Men to hit more than Women does not appear to be supported by the data. There are definitely some differences between how Men and Women play the game, but on aggregate these differences seem too small to detect on the scale of an individual game. However, this study has barely scratched the surface of what can be investigated with this dataset, so stay tuned for future analyses!